Case study 04 / Quality intelligence
A clear path from problem to impact
Turning complaint data into a clear quality story
A year-over-year FLAVIA quality review that made progress, emerging risks, and priorities easy to understand.
RoleFood & Promo Quality Specialist
AudienceQuality leaders & non-technical stakeholders
FocusTrend analysis · Quality management
ToolsPower BI · Excel · SharePoint
01
Situation
The numbers existed, but the quality story was hard to see.
Complaint information was available across operational reports, but stakeholders still had to interpret separate numbers to understand whether FLAVIA quality was improving and which categories needed attention.
Continue to Task ↓02
Task
Create a fair comparison that answered management’s real questions.
I needed to compare 2024 and 2025 performance consistently, make high-complaint areas immediately visible, and give non-technical stakeholders a concise narrative they could use in decision-making.
03
Action
I structured the comparison before designing the report.
I aligned complaint categories across both years, separated high-level performance from category-level detail, and paired direct labels with short written takeaways.
Aligned the data
Standardized the comparison so the same complaint categories were measured across both years.
Organized the signal
Separated improving issues from emerging and persistent concerns.
Designed for clarity
Used consistent scales, plain-language labels, and management-ready summaries.
Connected insight to action
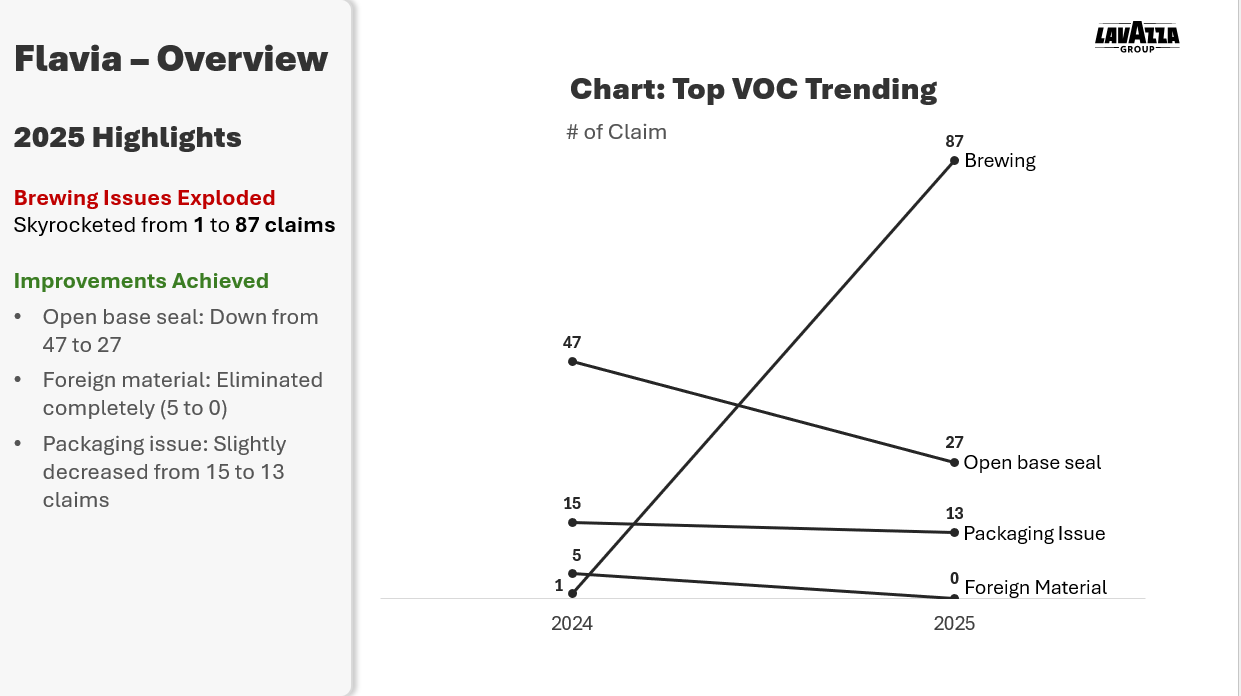
Highlighted brewing complaints as the next priority for investigation.
Selected report view
The work, in practice.
04
Result
Measured impact
During the annual meeting between the Production and Continuous Improvement teams, attendees quickly recognized both the positive overall trend and the areas of concern. This prompted the teams to prioritize a thorough investigation of brewing-related issues. As a result of the corrective actions implemented, brewing issues were reduced by 80% by the end of 2025.
Capabilities demonstrated