Case study 02 / Corrective action
A clear path from problem to impact
Showing whether corrective actions were actually working
A visual trend review that connected corrective actions to monthly Quality performance across product classifications.
RoleFood & Promo Quality Specialist
AudienceQuality, Operations & product teams
FocusCorrective action · Trend analysis
ToolsExcel · Power BI · Quality records
01
Situation
Teams were taking action, but effectiveness was difficult to prove.
Issue counts were reviewed month by month, making it difficult to see whether corrective actions created sustained improvement or only a temporary change in performance.
Continue to Task ↓02
Task
Turn monthly records into a reliable effectiveness check.
I needed to create a view that showed the pattern before and after corrective action, preserved the difference between product classifications, and made recurring issues easy to spot.
03
Action
I built a visual control for the full improvement cycle.
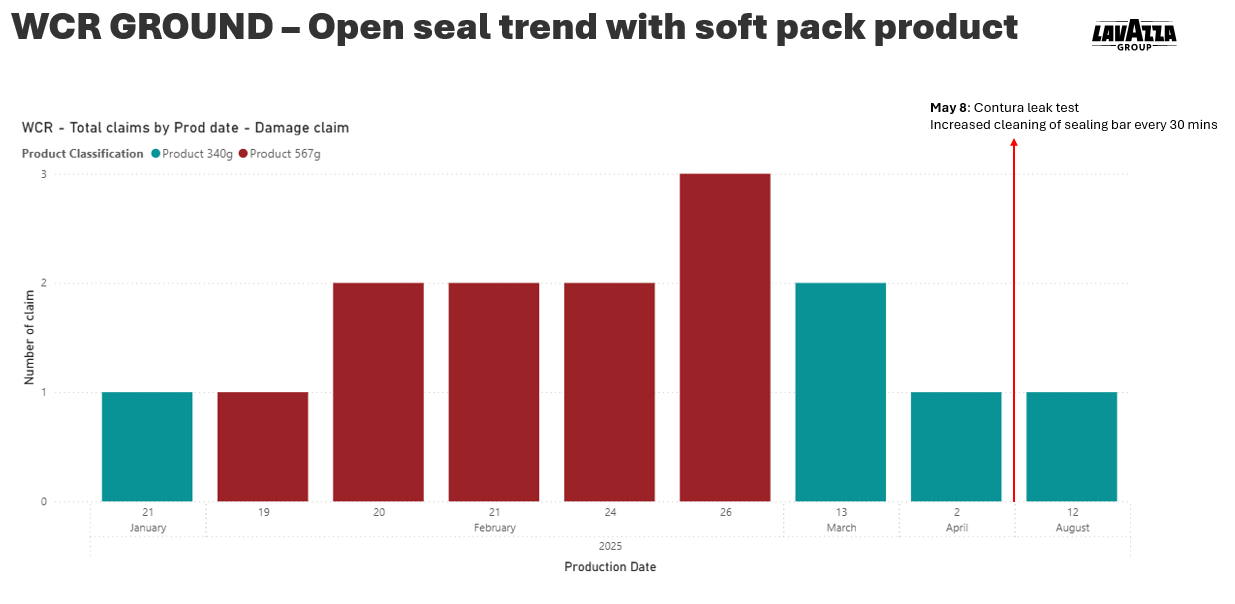
I cleaned and grouped the monthly issue data, plotted both classifications on a consistent timeline, and annotated the report so the team could connect changes in the trend to the corrective action taken.
Prepared the history
Standardized monthly issue records and classification labels.
Built the comparison
Used a consistent time axis to reveal direction, recurrence, and sustained improvement.
Added context
Connected the trend to the timing and intent of corrective actions.
Created a review habit
Used the visual as an ongoing effectiveness check rather than a one-time presentation.
Selected report view
The work, in practice.
04
Result
Measured outcome
The trend showed a near-complete elimination of monthly issues across both classifications.
The team gained a simpler, evidence-based way to confirm that corrective actions were holding and to recognize quickly when an issue began to return.
Capabilities demonstrated