Case study 03 / Power BI
A clear path from problem to impact
Building one actionable view from fragmented complaint data
A Power BI complaint dashboard designed to help U.S. and Italy Quality Directors move from manual review to focused investigation.
RolePower BI report designer & Quality analyst
AudienceQuality Directors in the U.S. and Italy
FocusData modeling · Dashboard design
ToolsPower BI · Power Query · Excel · SharePoint
01
Situation
Complaint analysis depended on labor-intensive Excel review.
Quality leaders received complaint information across multiple categories and files. Comparing trends, locations, products, and time periods required manual filtering, making recurring issues easy to miss and investigations slower to start.
Continue to Task ↓02
Task
Design a Power BI experience that made nine complaint categories usable.
I was responsible for consolidating the data, establishing consistent measures, and creating a dashboard that both U.S. and Italy Quality Directors could navigate without technical support.
03
Action
I designed the data model and the decision path together.
I transformed and standardized the source data in Power Query, created reusable measures in Power BI, then organized the report from overview to detail so each visual answered a specific business question.
Prepared the data
Cleaned category names, dates, products, and source fields into a consistent structure.
Modeled the measures
Created repeatable calculations for volume, trend, category, and period comparison.
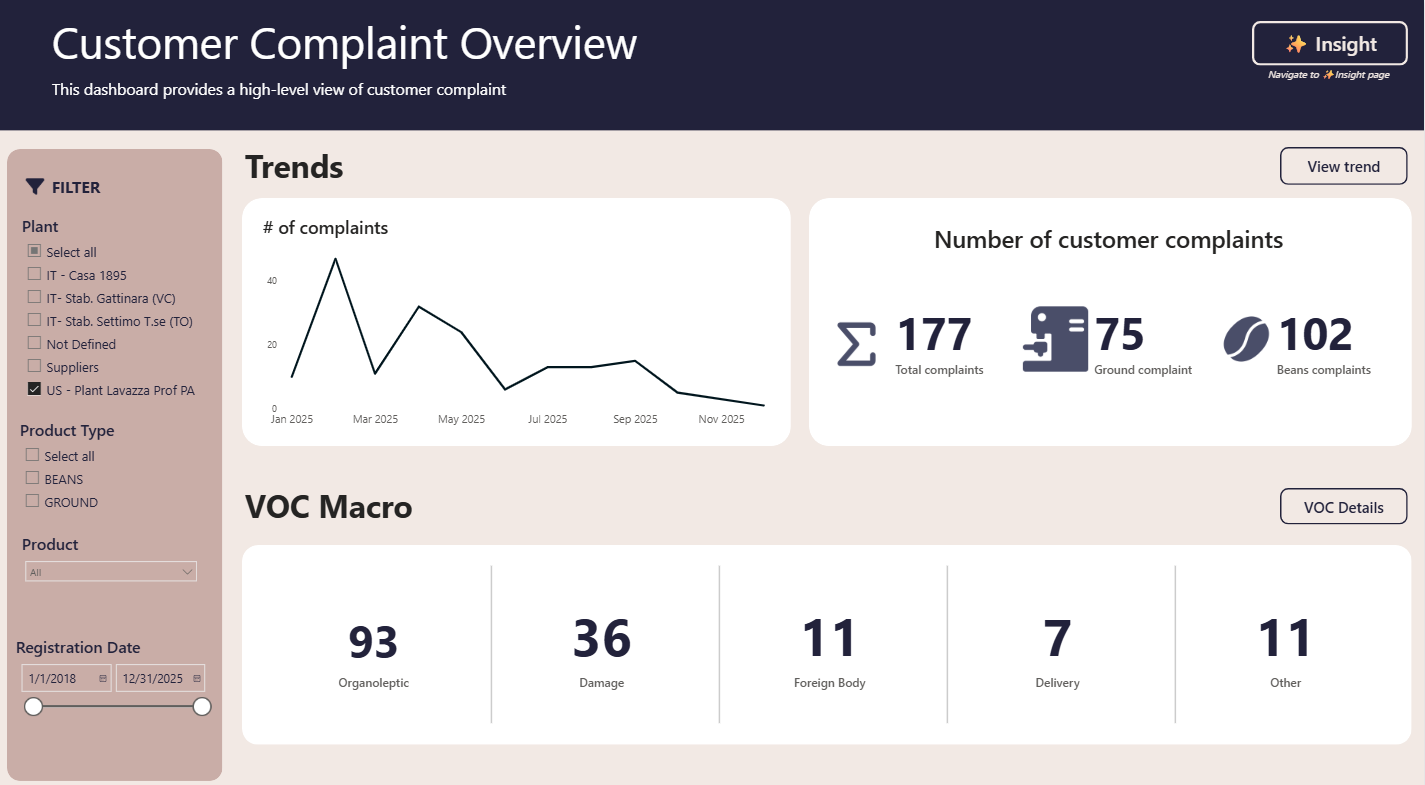
Designed the overview
Prioritized the KPIs, filters, and categories leaders needed for routine review.
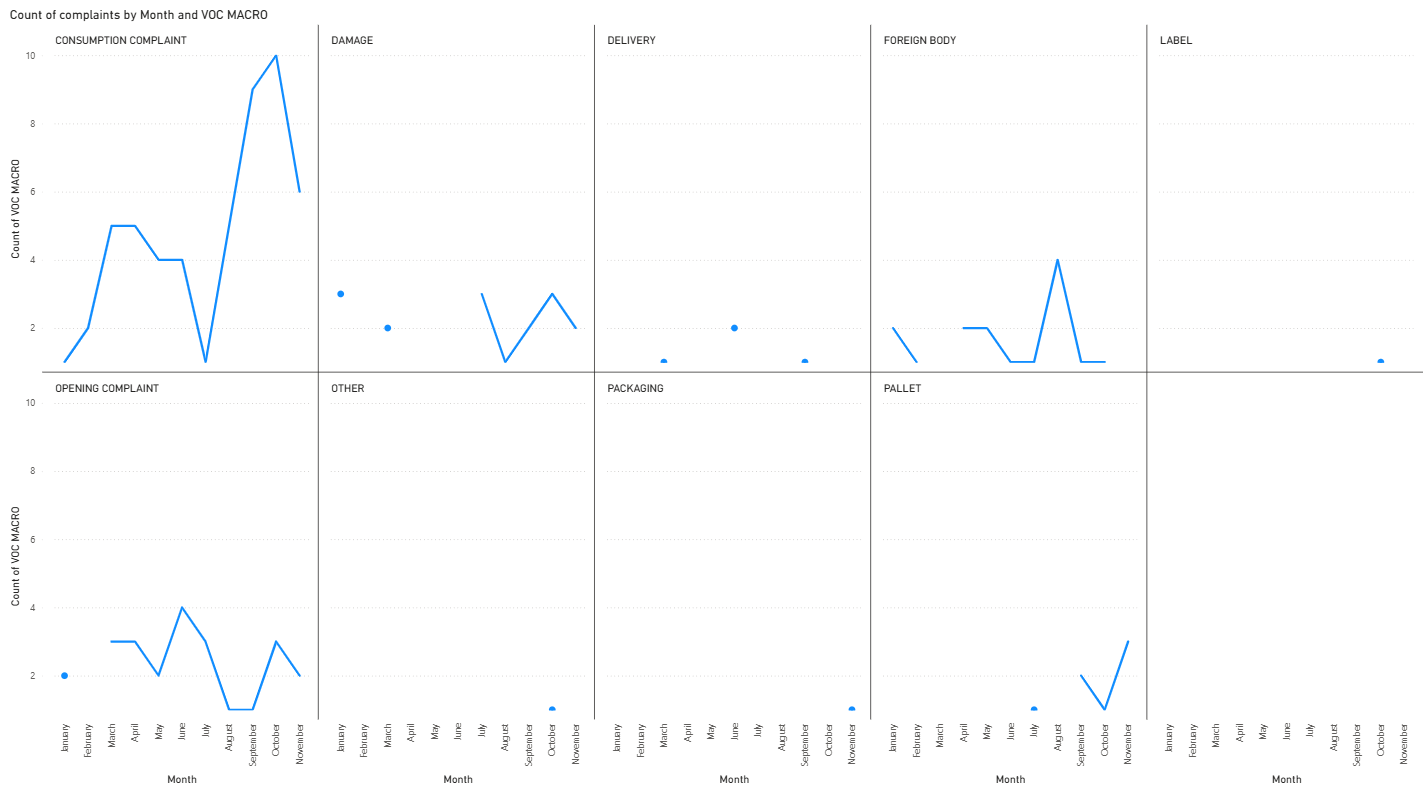
Enabled investigation
Added small multiples and focused views to reveal patterns hidden in the total.
Selected report views
The work, in practice.
04
Result
Result
Quality leaders could move from overview to investigation in one report.
The dashboard replaced repeated manual review with a consistent, interactive view. It helped leaders spot trends faster, focus investigations, and support decisions with the same underlying data.
Capabilities demonstrated